
`worldfootballR` Tutorial: Analysing League of Ireland with Fotmob Data
The Greatest League in the World!

Analysing League of Ireland with Fotmob Data
Introduction to the worldfootballR R package
The worldfootballR R package is a powerful tool designed for analysts, data scientists, and football enthusiasts who seek to harness the wealth of data available from top football (soccer) leagues around the globe. This package simplifies the process of accessing, manipulating, and analysing football data, providing users with the tools necessary to gain insights into the beautiful game.
Key Features
Comprehensive Data Access
worldfootballR offers access to a wide range of football data, including player statistics, match results, team performance metrics, and more. The package sources its data from reliable and reputable football databases, ensuring accuracy and up-to-date information.
User-Friendly Functions
The package includes a variety of functions that cater to different aspects of football analysis. Whether you're interested in player performance over a season, head-to-head team comparisons, or detailed match statistics, worldfootballR has you covered. The functions are designed to be intuitive and user-friendly, making it easy for users of all skill levels to perform complex analyses.
Data Wrangling and Visualization
Beyond just data retrieval, worldfootballR provides tools for data wrangling and visualization. Users can clean, manipulate, and visualize their data directly within R, streamlining the workflow from data acquisition to presentation. This feature is particularly useful for creating compelling visual narratives to support analyses and findings.
Compatibility with Other Packages
worldfootballR is designed to integrate seamlessly with other popular R packages, such as dplyr for data manipulation and ggplot2 for data visualization. This compatibility allows users to leverage the strengths of multiple packages, enhancing their analytical capabilities.
Use Cases
Performance Analysis
Football analysts can use worldfootballR to delve into player and team performance metrics. By analysing various statistics such as goals, assists, passes, and defensive actions, users can identify strengths and weaknesses, track player development, and make data-driven decisions.
Betting and Fantasy Football
For those involved in sports betting or fantasy football, worldfootballR provides the data needed to make informed choices. Access to historical data and performance trends can help users predict outcomes and optimize their fantasy teams.
Research and Reporting
Researchers and journalists can utilize worldfootballR to gather data for articles, reports, and academic studies. The package's ability to retrieve and process large datasets quickly makes it an invaluable tool for thorough and accurate reporting.
Coaching and Scouting
Coaches and scouts can leverage the package to analyse potential recruits and opponents. By examining detailed player statistics and match data, they can make informed decisions on player acquisitions and match strategies.
Data Sources
worldfootballR pulls data from several well-known football databases and websites, including:
- FBref: Provides detailed player and team statistics for various leagues.
- Transfermarkt: Offers data on player transfers, market values, and team compositions.
- Understat: Specializes in expected goals (xG) data and other advanced metrics.
- fotmob: Supplies live match updates and stats. More details below.
Introduction to the fotmob R Package
The fotmob R package is an essential tool for football analysts, data scientists, and enthusiasts who want to access and analyse real-time and historical football data from Fotmob, a popular platform for football statistics and live scores. This package provides convenient functions to retrieve a wide array of data, including match results, player statistics, team performance, and league standings, directly into R for further analysis and visualization.
Key Features
Comprehensive Data Access
The fotmob package allows users to access extensive football data, including:
- Match details: Real-time and historical match results, including scores, line-ups, and events.
- Player statistics: Individual player performance metrics across various matches and seasons.
- Team statistics: Team performance data, including standings, results, and comparisons.
- League information: Data on league standings, schedules, and fixtures.
User-Friendly Functions
The package offers straightforward functions designed to make data retrieval easy and efficient. Users can quickly fetch specific datasets without needing to manually parse or scrape data from the Fotmob website.
Integration with R Ecosystem
fotmob integrates seamlessly with other popular R packages such as dplyr for data manipulation and ggplot2 for data visualization, allowing users to perform comprehensive analyses and create compelling visual representations of football data.
Conclusion
The worldfootballR R package is a versatile and comprehensive tool for football data analysis. Its ability to access and process a wide range of data from multiple sources makes it invaluable for analysts, researchers, and enthusiasts. Whether you're conducting performance analysis, preparing for a fantasy football draft, or writing a detailed report, worldfootballR provides the functions and tools necessary to achieve your goals efficiently and effectively.
The fotmob R package is an invaluable resource for anyone interested in football data analysis. By offering easy access to comprehensive and up-to-date football data, it enables users to perform detailed analyses, generate insightful visualizations, and make informed decisions. Whether you're a professional analyst, a researcher, a sports journalist, or a football fan, the fotmob package provides the tools you need to explore and understand the dynamics of the game.
With its user-friendly functions, integration with other R packages, and extensive documentation and support, fotmob stands out as a must-have package for football data enthusiasts. By leveraging the power of R and the wealth of data for the League of Ireland available through Fotmob, users can unlock new insights, discover trends, and gain a deeper understanding of the beautiful game.
The extensive list of features and capabilities of the worldfootballR and fotmob packages can be found through the package help pages, documentation, and tutorials. These resources provide detailed information on how to use the functions effectively, troubleshoot common issues, and maximize the potential of the packages for football data analysis.
Prerequisites
Install packages
install.packages("devtools", repos="http://cran.us.r-project.org")
install.packages("remotes", repos="http://cran.us.r-project.org")
remotes::install_github("tonyelhabr/fotmob", repos="http://cran.us.r-project.org")
devtools::install_github("JaseZiv/worldfootballR")
Load packages
library(tidyverse)
library(fotmob)
library(worldfootballR)
Data Retrieval
Fotmob League ID's
This provides a dataframe with the Fotmob league ID's and their corresponding league names. To make use of the Fotmob API, you will need the league ID to retrieve data for a specific league.
fotmob_league_ids <- fotmob_get_league_ids(cached = TRUE)
Fotmob Team Statistics
This function retrieves team statistics for a specific league and season. The data includes various performance metrics such as goals scored, goals conceded, shots on target, and more. The function requires the country, league name, season name, and league ID as inputs.
Retrieve Premier Division team statistics for the 2024 season
prem_loi_team <- fotmob_get_season_stats(
  country = "IRL",
  league_name = "Premier Division",
  season_name = "2024",
  league_id = "126",
  team_or_player = "team",
  stat_name = c("Accurate crosses per match",
                "Accurate long balls per match",
                "Accurate passes per match",
                "Average possession",
                "Big chances",
                "Big chances missed",
                "Clean sheets",
                "Clearances per match",
                "Corners",
                "FotMob rating",
                "Fouls per match",
                "Goals conceded per match",
                "Goals per match",
                "Interceptions per match",
                "Penalties awarded",
                "Penalties conceded",
                "Possession won final 3rd per match",
                "Red cards",
                "Saves per match",
                "Shots on target per match",
                "Successful tackles per match",
                "Touches in opposition box",
                "Yellow cards"),
  cached = TRUE
)
Remove unnecessary columns
prem_loi_team <- prem_loi_team %>%
  select(-c("country", "team_color", "league_id", "season_id", "stat_league_name", "particiant_id", "team_name", "participant_country_code", "rank", "stat", "sub_stat_value", "minutes_played", "stat_value_count"))
Reorder columns
prem_loi_team <- prem_loi_team %>%
  select(c("league_name", "season_name", "team_id", "participant_name", "matches_played", "stat_name", "stat_value"))
Pivot stat_name and stat_value columns wider and clean names
prem_loi_team_wide <- prem_loi_team %>%
  pivot_wider(names_from = stat_name, values_from = stat_value) %>%
  janitor::clean_names() %>%
  mutate_if(is.numeric, ~replace(., is.na(.), 0)) %>% # Convert NA values to 0
  select(-fot_mob_rating) # Remove FotMob rating column
View the team statistics data in a gt table
gt::gt(prem_loi_team_wide)
Plotting Some Data
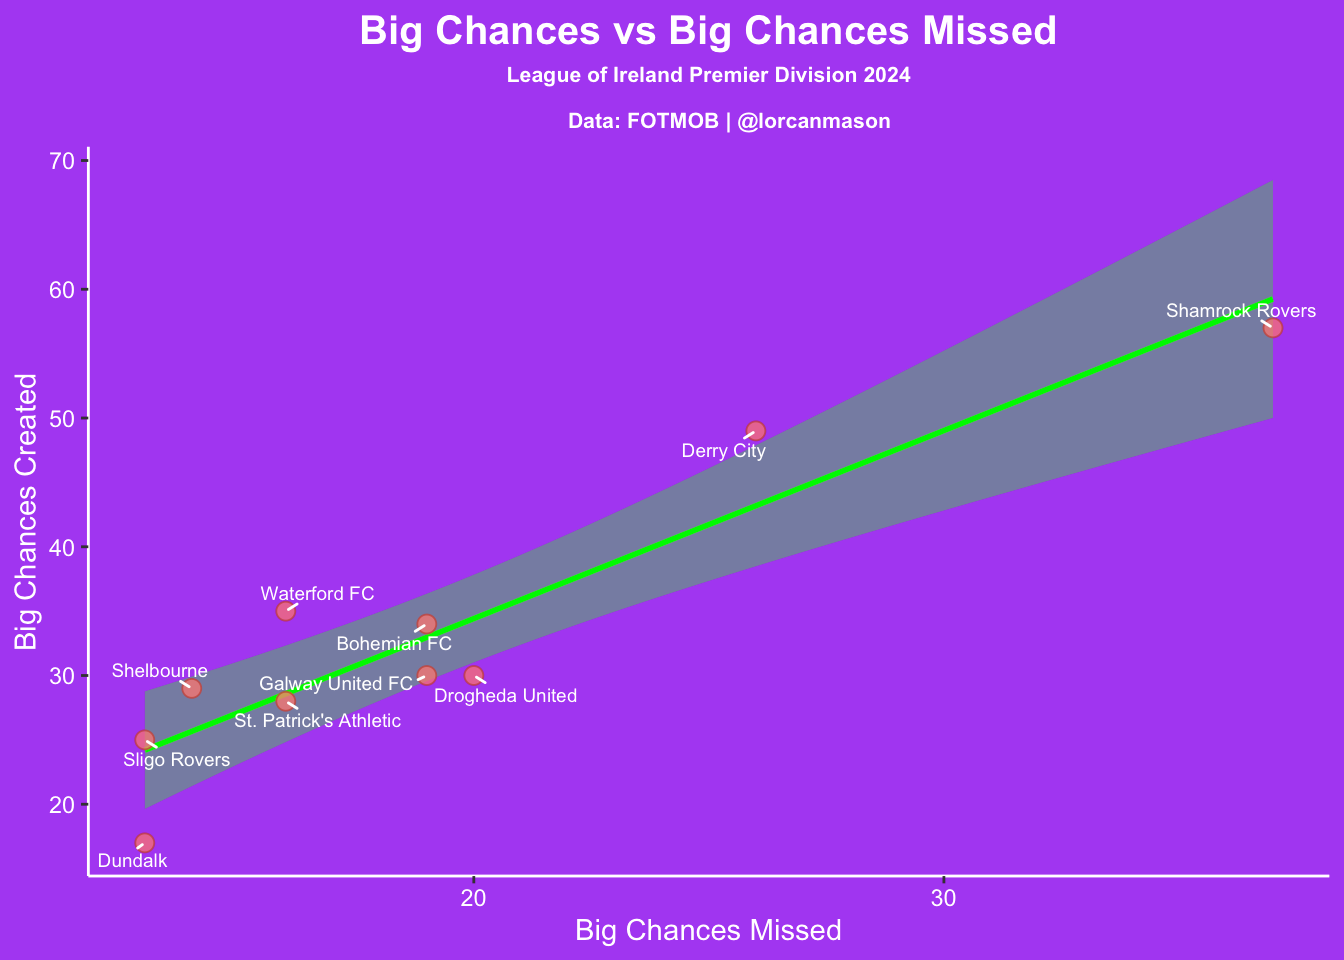
Plotting Big Chances vs Big Chances Missed
library(ggplot2)
library(ggrepel)
library(scales)
library(prismatic)

ggplot(prem_loi_team_wide, aes(x = big_chances_missed, y = big_chances, label = participant_name)) +
  #1: This code sets up the plot and tells it what data to use and what
  # columns to use for the x and y axis.
  geom_smooth(method = "lm", color = "green", fill = "green") +
  #2: This code tells it to create a linear regression line on the plot.
  # method = "lm" tells it to use a linear model, colour = "green" sets the
  # colour of the line, and fill = "green" sets the fill colour of the line.
geom_point(aes(fill = "green", color = after_scale(clr_darken(fill, 0.3))),
             shape = 21,
             alpha = .75,
             size = 3) +
  #3: This code tells it to create points on the plot. aes(fill = "green",
  # color = after_scale(clr_darken(fill, 0.3))) sets the fill and colour of
  # the points, shape = 21 sets the shape of the points, alpha = .75 sets
  # the transparency of the points, and size = 3 sets the size of the points.
  ggrepel::geom_text_repel(size = 2.5, color = "white", min.segment.length = unit(0.1, "lines")) +
  #4: This code tells it to create text labels on the plot. size = 2.5 sets
  # the size of the text, colour = "white" sets the colour of the text,
  # and min.segment.length = unit(0.1, "lines") sets the minimum length of the segments.
  theme(
    legend.position = "none",
    plot.background = element_rect(fill = "purple", colour = "purple"),
    panel.background = element_rect(fill = "purple", colour = "purple"),
    panel.grid.major = element_line(colour = "purple"),
    panel.grid.minor = element_blank(),
    axis.line = element_line(colour = "white"),
    axis.text = element_text(colour = "white"),
    axis.title = element_text(colour = "white"),
    plot.title = element_text(colour = "white", hjust=.5, face="bold", size = 15),
    plot.subtitle = element_text(colour = "white", hjust=.5, face="bold", size = 8)) +
  labs(x = "Big Chances Missed",
       y = "Big Chances Created",
       title = "Big Chances vs Big Chances Missed",
       subtitle = "League of Ireland Premier Division 2024

       Data: FOTMOB | @lorcanmason")

Plotting Possession Won in Final 3rd vs Big Chances
ggplot(prem_loi_team_wide, aes(x = big_chances, y = possession_won_final_3rd_per_match, label = participant_name)) +
  #1: This code sets up the plot and tells it what data to use and what
  # columns to use for the x and y axis.
  geom_smooth(method = "lm", color = "green", fill = "green") +
  #2: This code tells it to create a linear regression line on the plot.
  # method = "lm" tells it to use a linear model, colour = "green" sets the
  # colour of the line, and fill = "green" sets the fill colour of the line.
geom_point(aes(fill = "green", color = after_scale(clr_darken(fill, 0.3))),
             shape = 21,
             alpha = .75,
             size = 3) +
  #3: This code tells it to create points on the plot. aes(fill = "green",
  # color = after_scale(clr_darken(fill, 0.3))) sets the fill and colour of
  # the points, shape = 21 sets the shape of the points, alpha = .75 sets
  # the transparency of the points, and size = 3 sets the size of the points.
  ggrepel::geom_text_repel(size = 2.5, color = "white", min.segment.length = unit(0.1, "lines")) +
  #4: This code tells it to create text labels on the plot. size = 2.5 sets
  # the size of the text, colour = "white" sets the colour of the text,
  # and min.segment.length = unit(0.1, "lines") sets the minimum length of the segments.
  theme(
    legend.position = "none",
    plot.background = element_rect(fill = "purple", colour = "purple"),
    panel.background = element_rect(fill = "purple", colour = "purple"),
    panel.grid.major = element_line(colour = "purple"),
    panel.grid.minor = element_blank(),
    axis.line = element_line(colour = "white"),
    axis.text = element_text(colour = "white"),
    axis.title = element_text(colour = "white"),
    plot.title = element_text(colour = "white", hjust=.5, face="bold", size = 15),
    plot.subtitle = element_text(colour = "white", hjust=.5, face="bold", size = 8)) +
  labs(y = "Possession Won in Final 3rd",
       x = "Big Chances Created",
       title = "Possession Won in Final 3rd vs Big Chances",
       subtitle = "League of Ireland Premier Division 2024

       Data: FOTMOB | @lorcanmason")

Plotting Average Possession vs Clean Sheets
ggplot(prem_loi_team_wide, aes(x = clean_sheets, y = average_possession, label = participant_name)) +
  #1: This code sets up the plot and tells it what data to use and what
  # columns to use for the x and y axis.
  geom_smooth(method = "lm", color = "green", fill = "green") +
  #2: This code tells it to create a linear regression line on the plot.
  # method = "lm" tells it to use a linear model, colour = "green" sets the
  # colour of the line, and fill = "green" sets the fill colour of the line.
geom_point(aes(fill = "green", color = after_scale(clr_darken(fill, 0.3))),
             shape = 21,
             alpha = .75,
             size = 3) +
  #3: This code tells it to create points on the plot. aes(fill = "green",
  # color = after_scale(clr_darken(fill, 0.3))) sets the fill and colour of
  # the points, shape = 21 sets the shape of the points, alpha = .75 sets
  # the transparency of the points, and size = 3 sets the size of the points.
  ggrepel::geom_text_repel(size = 2.5, color = "white", min.segment.length = unit(0.1, "lines")) +
  #4: This code tells it to create text labels on the plot. size = 2.5 sets
  # the size of the text, colour = "white" sets the colour of the text,
  # and min.segment.length = unit(0.1, "lines") sets the minimum length of the segments.
  theme(
    legend.position = "none",
    plot.background = element_rect(fill = "purple", colour = "purple"),
    panel.background = element_rect(fill = "purple", colour = "purple"),
    panel.grid.major = element_line(colour = "purple"),
    panel.grid.minor = element_blank(),
    axis.line = element_line(colour = "white"),
    axis.text = element_text(colour = "white"),
    axis.title = element_text(colour = "white"),
    plot.title = element_text(colour = "white", hjust=.5, face="bold", size = 15),
    plot.subtitle = element_text(colour = "white", hjust=.5, face="bold", size = 8)) +
  labs(x = "Clean Sheets",
       y = "Average Possession",
       title = "Average Possession vs Clean Sheets",
       subtitle = "League of Ireland Premier Division 2024

       Data: FOTMOB | @lorcanmason")

Plotting Average Possession vs Touches in Opposition Box
ggplot(prem_loi_team_wide, aes(x = touches_in_opposition_box, y = average_possession, label = participant_name)) +
  #1: This code sets up the plot and tells it what data to use and what
  # columns to use for the x and y axis.
  geom_smooth(method = "lm", color = "green", fill = "green") +
  #2: This code tells it to create a linear regression line on the plot.
  # method = "lm" tells it to use a linear model, colour = "green" sets the
  # colour of the line, and fill = "green" sets the fill colour of the line.
geom_point(aes(fill = "green", color = after_scale(clr_darken(fill, 0.3))),
             shape = 21,
             alpha = .75,
             size = 3) +
  #3: This code tells it to create points on the plot. aes(fill = "green",
  # color = after_scale(clr_darken(fill, 0.3))) sets the fill and colour of
  # the points, shape = 21 sets the shape of the points, alpha = .75 sets
  # the transparency of the points, and size = 3 sets the size of the points.
  ggrepel::geom_text_repel(size = 2.5, color = "white", min.segment.length = unit(0.1, "lines")) +
  #4: This code tells it to create text labels on the plot. size = 2.5 sets
  # the size of the text, colour = "white" sets the colour of the text,
  # and min.segment.length = unit(0.1, "lines") sets the minimum length of the segments.
  theme(
    legend.position = "none",
    plot.background = element_rect(fill = "purple", colour = "purple"),
    panel.background = element_rect(fill = "purple", colour = "purple"),
    panel.grid.major = element_line(colour = "purple"),
    panel.grid.minor = element_blank(),
    axis.line = element_line(colour = "white"),
    axis.text = element_text(colour = "white"),
    axis.title = element_text(colour = "white"),
    plot.title = element_text(colour = "white", hjust=.5, face="bold", size = 15),
    plot.subtitle = element_text(colour = "white", hjust=.5, face="bold", size = 8)) +
  labs(x = "Touches in Opposition Box",
       y = "Average Possession",
       title = "Average Possession vs Touches in Oposition Box",
       subtitle = "League of Ireland Premier Division 2024

       Data: FOTMOB | @lorcanmason")

Plotting Average Possession vs Accurate Passes per Match
ggplot(prem_loi_team_wide, aes(x = accurate_passes_per_match, y = average_possession, label = participant_name)) +
  #1: This code sets up the plot and tells it what data to use and what
  # columns to use for the x and y axis.
  geom_smooth(method = "lm", color = "green", fill = "green") +
  #2: This code tells it to create a linear regression line on the plot.
  # method = "lm" tells it to use a linear model, colour = "green" sets the
  # colour of the line, and fill = "green" sets the fill colour of the line.
geom_point(aes(fill = "green", color = after_scale(clr_darken(fill, 0.3))),
             shape = 21,
             alpha = .75,
             size = 3) +
  #3: This code tells it to create points on the plot. aes(fill = "green",
  # color = after_scale(clr_darken(fill, 0.3))) sets the fill and colour of
  # the points, shape = 21 sets the shape of the points, alpha = .75 sets
  # the transparency of the points, and size = 3 sets the size of the points.
  ggrepel::geom_text_repel(size = 2.5, color = "white", min.segment.length = unit(0.1, "lines")) +
  #4: This code tells it to create text labels on the plot. size = 2.5 sets
  # the size of the text, colour = "white" sets the colour of the text,
  # and min.segment.length = unit(0.1, "lines") sets the minimum length of the segments.
  theme(
    legend.position = "none",
    plot.background = element_rect(fill = "purple", colour = "purple"),
    panel.background = element_rect(fill = "purple", colour = "purple"),
    panel.grid.major = element_line(colour = "purple"),
    panel.grid.minor = element_blank(),
    axis.line = element_line(colour = "white"),
    axis.text = element_text(colour = "white"),
    axis.title = element_text(colour = "white"),
    plot.title = element_text(colour = "white", hjust=.5, face="bold", size = 15),
    plot.subtitle = element_text(colour = "white", hjust=.5, face="bold", size = 8)) +
  labs(x = "Accurate Passes per Match",
       y = "Average Possession",
       title = "Average Possession vs Accurate Passes per Match",
       subtitle = "League of Ireland Premier Division 2024

       Data: FOTMOB | @lorcanmason")
