R for Data Science Exercises: Workflow Scripts and Projects and Data Import
The final installment of exercises from the "Whole game" section of the R4DS 2nd edition. These exercises focus on becoming more familiar and efficient in R studio.

R for Data Science 2nd Edition Exercises (Wickham, Mine Çetinkaya-Rundel and Grolemund, 2023)
Workflow Scripts and Projects
Run the code in your script for the answers! I'm just exploring as I go.
Workflow Scripts and Projects Tips
"Option + Shift + K" or "Alt + Shift + K" shows the keyboard shortcuts available. You can also go to the menu bar: Tools > Keyboard shortcuts help.
Tools > Global Options > Appearance allows you to change the theme of your RStudio.
RStudio will warn with a caution icon (orange triangle with an exclamation point in it) if variable used in your code is not defined in your scope (i.e., your environment).

Use the script editor instead of the console -> complex pipelines and graphics.
File -> New file -> R script, or "Cmd/Ctrl + Shift + N" for the best place for experimenting with your R code.
Edit the script and re-run the code. Save it as a R code file: yourfilename.R.
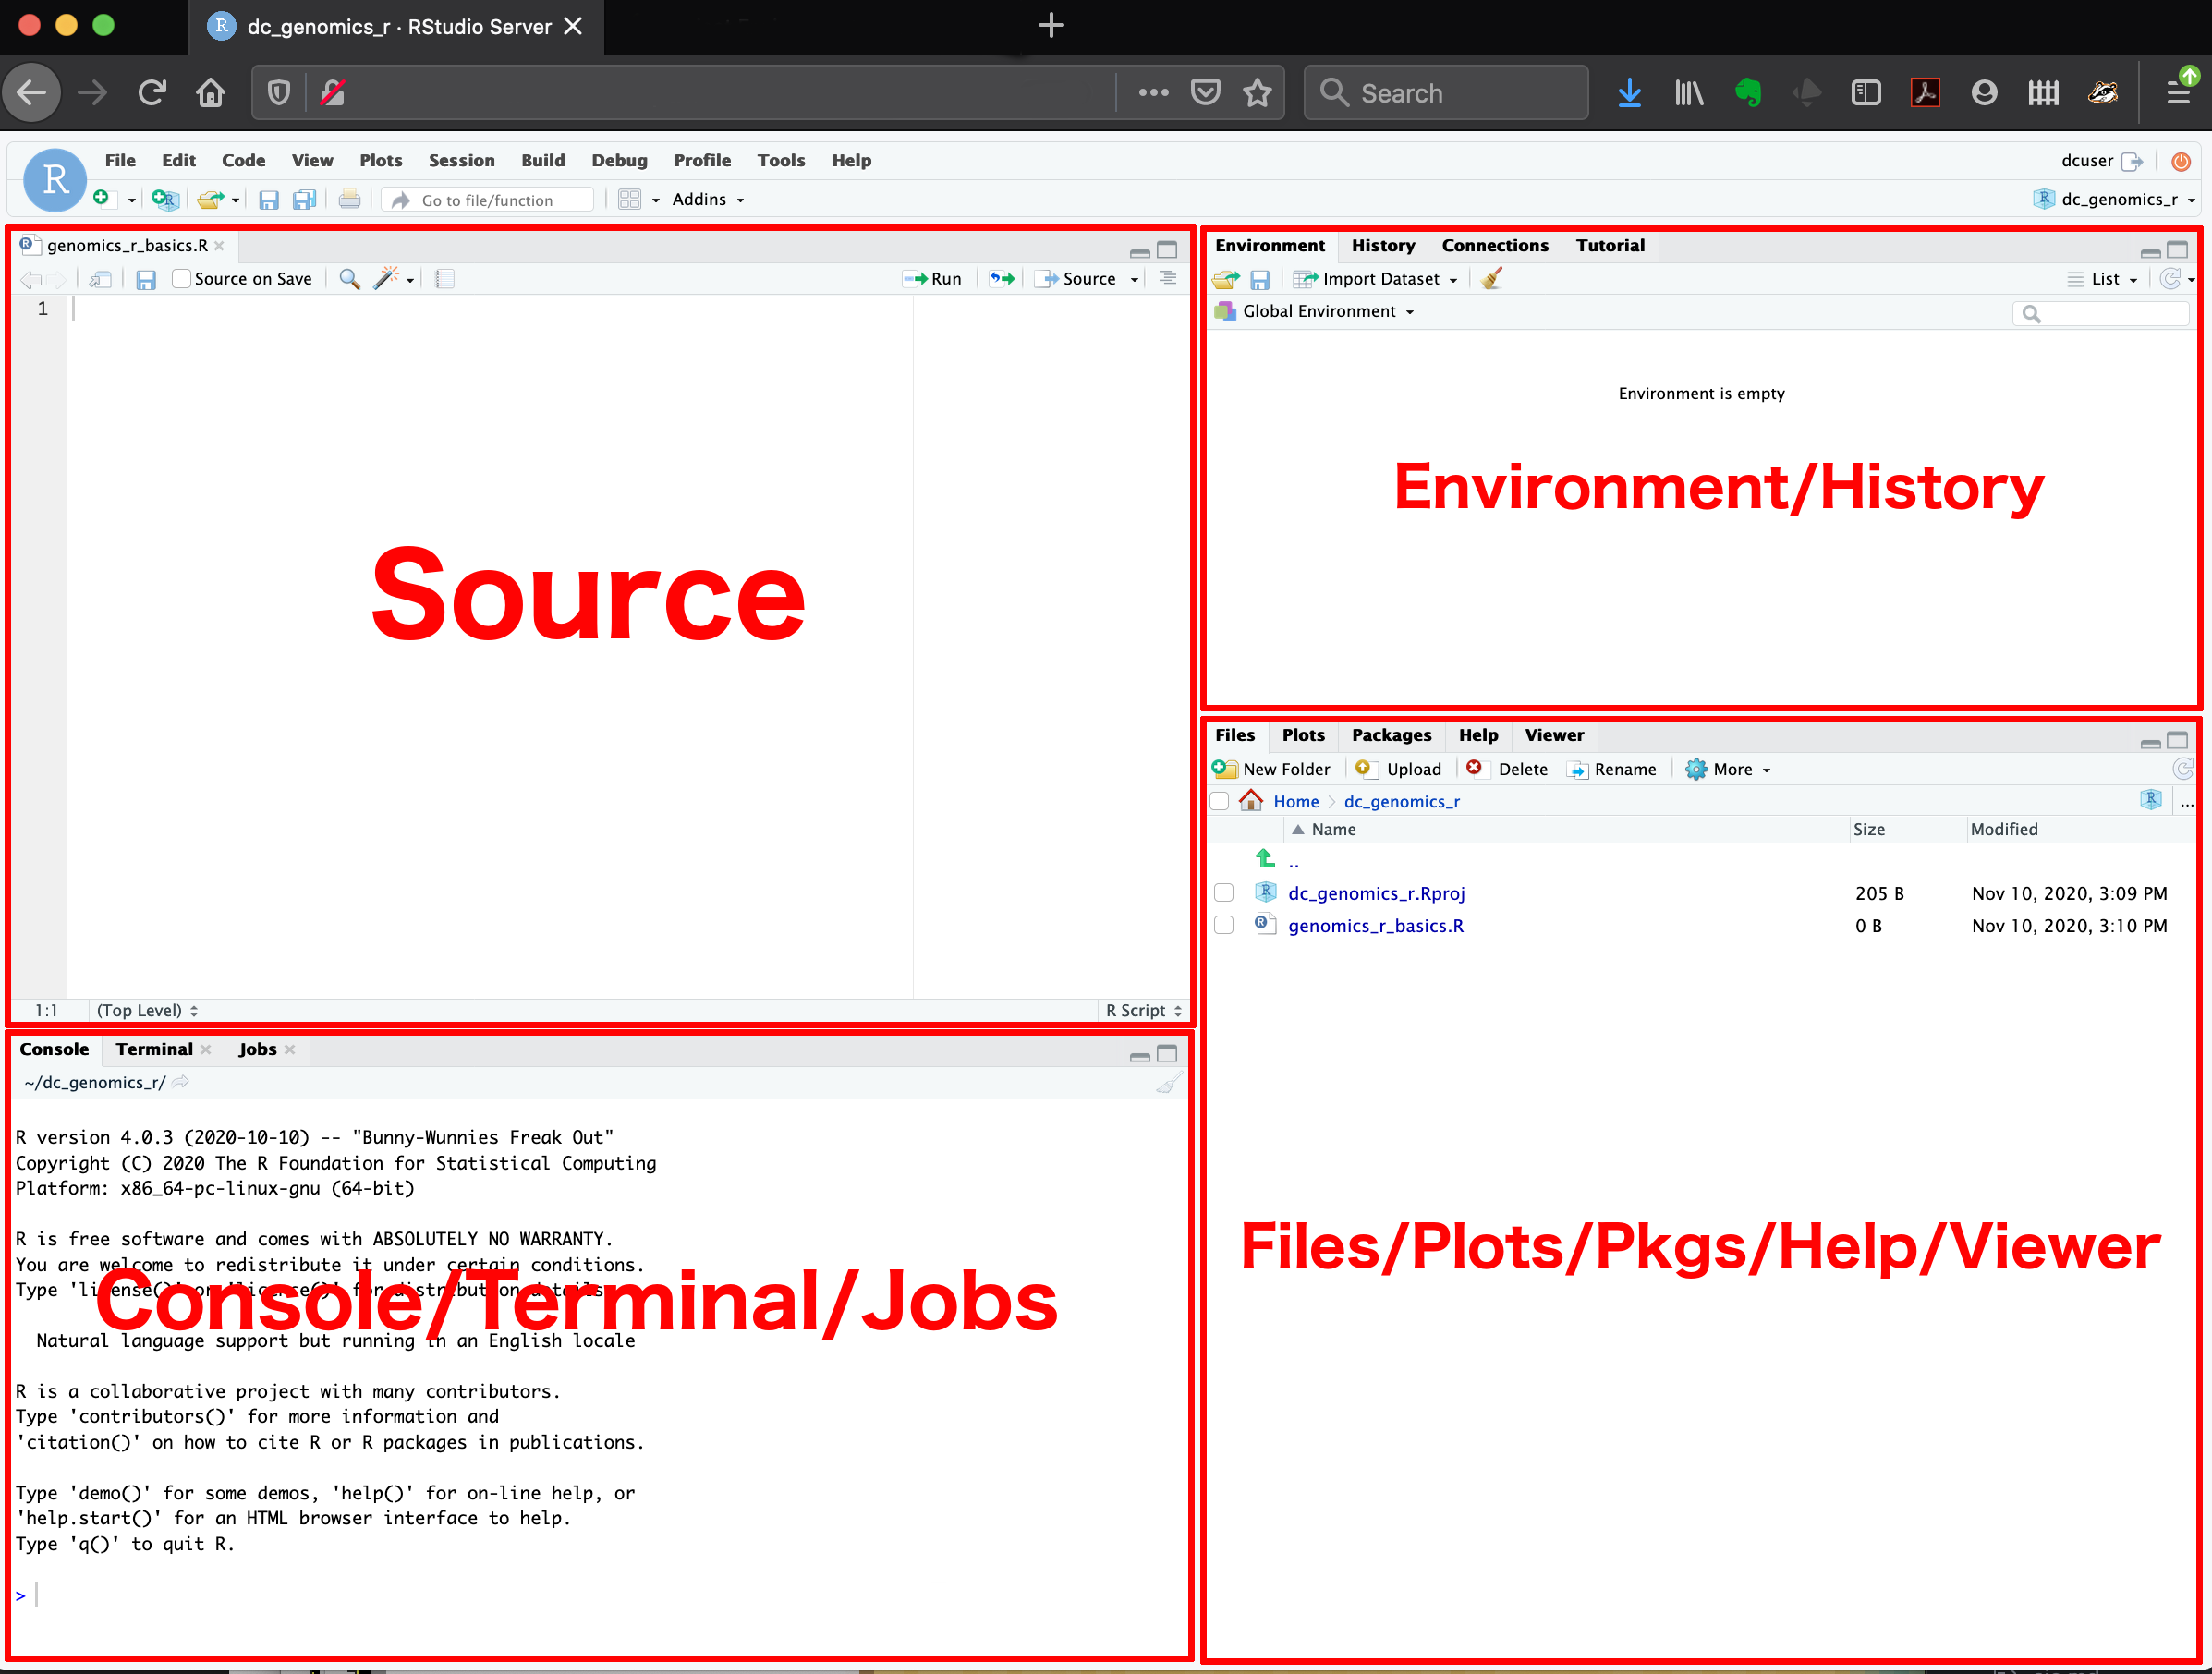
You can move panes around too.
-
Move focus to script "CTRL/Cmd + 1".
-
Move focus to console "CTRL/Cmd + 2".
-
Move focus to Terminal "ALT + Shift + M".
To run the current R expression in the console "Ctrl/Cmd + Enter".
- The cursor will then move to the next code block.
To run the entire script "Ctrl/Cmd + Shift + S".
getwd() identifies the current working directory.
You can always find the working directory by looking at top of console too:

Data Import
Packages to load
library(tidyverse)
- What function would you use to read a file where fields were separated with "|"?
For reading a file delimited with |, use read_delim() with argument delim = "|".
- Apart from
file,skip, andcomment, what other arguments doread_csv()andread_tsv()have in common?
All other arguments are common among the two functions: col_names, col_types, col_select, id, locale, na, quoted_na, quote, comment, trim_ws, n_max, guess_max, progress, name_repair, num_threads, show_col_types, skip_empty_rows, lazy.
- What are the most important arguments to
read_fwf()?
col_positions is an important argument since it defines the beginning and end of columns. file, fwf_cols, fwf_positions, fwf_widths, and fwf_empty are also important arguments.
-
Sometimes strings in a CSV file contain commas. To prevent them from causing problems, they need to be surrounded by a quoting character, like
"or'. By default,read_csv()assumes that the quoting character will be". To read the following text into a data frame, what argument toread_csv()do you need to specify?A. Example Code:
a. `"x,y\n1,'a,b'"` *We need to specify the `quote` argument. `quote = "''"` to specify that we are using `''` as quotes in a string.* ```{r} read_csv("x,y\n1,'a,b'", quote = "\'") ``` -
Identify what is wrong with each of the following inline CSV files. What happens when you run the code?
a.
read_csv("a,b\n1,2,3\n4,5,6")b.
read_csv("a,b,c\n1,2\n1,2,3,4")c.
read_csv("a,b\n"1")d.
read_csv("a,b\n1,2\na,b")e.
read_csv("a;b\n1;3")
a. There are only two column headers but three values in each row, so the last two get merged:
read_csv("a,b\n1,2,3\n4,5,6")
b. There are only three column headers, first row is missing a value in the last column so gets an NA there, the second row has four values so the last two get merged:
read_csv("a,b,c\n1,2\n1,2,3,4")
c. No rows are read in:
read_csv("a,b\n\"1")
d. Each column has a numerical and a character value, so the column type is coerced to character:
read_csv("a,b\n1,2\na,b")
e. The delimiter is ; but it's not specified, therefore this is read in as a single-column data frame with a single observation:
read_csv("a;b\n1;3")
-
Practice referring to non-syntactic names in the following data frame by:
a. Extracting the variable called
1.b. Plotting a scatterplot of
1vs.2.c. Creating a new column called
3, which is2divided by1.d. Renaming the columns to
one,two, andthree.
Example Data frame
annoying <- tibble(
  `1` = 1:10,
  `2` = `1` * 2 + rnorm(length(`1`))
)
a. Extracting the variable called 1:
```{r}
annoying |>
  select(`1`)
```
b. Plotting a scatterplot of 1 vs. 2:
```{r}
ggplot(annoying, aes(x = `2`, y = `1`)) +
  geom_point()
```
c. Creating a new column called 3, which is 2 divided by 1:
```{r}
annoying |>
  mutate(`3` = `2` / `1`)
```
d. Renaming the columns to one, two, and three:
```{r}
annoying |>
  mutate(`3` = `2` / `1`) |>
  rename(
    "one" = `1`,
    "two" = `2`,
    "three" = `3`
  )
```
Reference
Wickham, H., Mine Çetinkaya-Rundel and Grolemund, G. (2023) R for data science. 2nd ed. Sebastopol, CA: O’Reilly Media.

