
Player Performance in the League of Ireland Premier Division 2024
Ranking the top 25 players based on performance metrics in the League of Ireland Premier Division 2024.

Prerequisites
Install packages
install.packages("devtools", repos="http://cran.us.r-project.org")
install.packages("remotes", repos="http://cran.us.r-project.org")
remotes::install_github("tonyelhabr/fotmob", repos="http://cran.us.r-project.org")
devtools::install_github("JaseZiv/worldfootballR")
Load packages
library(tidyverse)
library(fotmob)
library(worldfootballR)
Data Retrieval
Fotmob League ID's
This provides a dataframe with the Fotmob league ID's and their corresponding league names. To make use of the Fotmob API, you will need the league ID to retrieve data for a specific league.
fotmob_league_ids <- fotmob_get_league_ids(cached = TRUE) # Retrieve Fotmob league IDs
Fotmob Player Statistics
This function retrieves player statistics for a specific league and season. The data includes individual player performance metrics such as goals, assists, passes, shots on target, and more. The function requires the country, league name, season name, and league ID as inputs.
prem_loi_player <- fotmob_get_season_stats(
  country = "IRL",
  league_name = "Premier Division",
  season_name = "2024",
  league_id = "126",
  team_or_player = "player",
  stat_name = c("Accurate long balls per 90",
                "Accurate passes per 90",
                "Assists",
                "Big chances created",
                "Big chances missed",
                "Blocks per 90",
                "Chances created",
                "Clean sheets",
                "Clearances per 90",
                "FotMob rating",
                "Fouls committed per 90",
                "Goals + Assists",
                "Goals conceded per 90",
                "Goals per 90",
                "Interceptions per 90",
                "Penalties conceded",
                "Penalties won",
                "Possession won final 3rd per 90",
                "Red cards",
                "Save percentage",
                "Saves per 90",
                "Shots on target per 90",
                "Shots per 90",
                "Successful dribbles per 90",
                "Successful tackles per 90",
                "Top scorer",
                "Yellow cards"),
  cached = TRUE
) # Retrieve player statistics for the League of Ireland Premier Division 2024
Select necessary columns
prem_loi_player <- prem_loi_player %>%
  select(c("league_name", "season_name", "team_name", "participant_country_code", "participant_name", "matches_played", "minutes_played", "stat_name", "stat_value")) # Select necessary columns to clean up the dataframe
Pivot stat_name and stat_value columns wider and clean names
prem_loi_player_wide <- prem_loi_player %>%
  pivot_wider(names_from = stat_name, values_from = stat_value) %>% # Pivot stat_name and stat_value columns wider (i.e., a new column for each stat_name)
  janitor::clean_names() %>% # Clean column names
  mutate_if(is.numeric, ~replace(., is.na(.), 0)) %>% # Convert NA values to 0
  select(-fot_mob_rating) # Remove FotMob rating column
Creating Custom Functions
Function to rank the top 25 players based on a specific performance metric
The function takes the dataframe and column name as inputs and returns the top 25 players based on the specified metric (column name).
top_25_players <- function(data, column_name) {
  top_25 <- data %>%
    select(league_name, season_name, team_name, participant_country_code, participant_name, matches_played, minutes_played, {{column_name}}) %>%
    filter(!is.na({{column_name}})) %>%
    arrange(desc({{column_name}})) %>%
    head(25)

  return(top_25)
}
The function top_25_players ranks the top 25 players based on a specific performance metric. The function takes two inputs: the dataframe containing player statistics and the column name of the performance metric you want to rank the players by. The function filters out any missing values for the specified metric, arranges the data in descending order based on the metric, and selects the top 25 players. The function returns a dataframe with the top 25 players ranked by the specified metric.
Using the function to get the top 25 players for different metrics
Create new dataframes for the top 25 players based on the different performance metrics. Each specified metric (e.g.: top_scorer) is passed through the function to get the top 25 players based on that metric. Below I have sectioned the data to focus on attacking, possession, and defensive metrics.
Top 25 Players Attacking Metrics
top_25_goals <- top_25_players(prem_loi_player_wide, top_scorer)
top_25_assists <- top_25_players(prem_loi_player_wide, assists)
top_25_goals_assists <- top_25_players(prem_loi_player_wide, goals_assists)
top_25_goals_per_90 <- top_25_players(prem_loi_player_wide, goals_per_90)
top_25_big_chances_created <- top_25_players(prem_loi_player_wide, big_chances_created)
top_25_big_chances_missed <- top_25_players(prem_loi_player_wide, big_chances_missed)
top_25_chances_created <- top_25_players(prem_loi_player_wide, chances_created)
top_25_shots_per_90 <- top_25_players(prem_loi_player_wide, shots_per_90)
top_25_shots_on_target_per_90 <- top_25_players(prem_loi_player_wide, shots_on_target_per_90)
Top 25 Players Possession Metrics
top_25_accurate_long_balls_per_90 <- top_25_players(prem_loi_player_wide, accurate_long_balls_per_90)
top_25_accurate_passes_per_90 <- top_25_players(prem_loi_player_wide, accurate_passes_per_90)
top_25_penalties_won <- top_25_players(prem_loi_player_wide, penalties_won)
top_25_successful_dribbles_per_90 <- top_25_players(prem_loi_player_wide, successful_dribbles_per_90)
Top 25 Players Defensive Metrics
top_25_blocks_per_90 <- top_25_players(prem_loi_player_wide, blocks_per_90)
top_25_clean_sheets <- top_25_players(prem_loi_player_wide, clean_sheets)
top_25_clearances_per_90 <- top_25_players(prem_loi_player_wide, clearances_per_90)
top_25_fouls_committed_per_90 <- top_25_players(prem_loi_player_wide, fouls_committed_per_90)
top_25_interceptions_per_90 <- top_25_players(prem_loi_player_wide, interceptions_per_90)
top_25_penalties_conceded <- top_25_players(prem_loi_player_wide, penalties_conceded)
top_25_possession_won_final_3rd_per_90 <- top_25_players(prem_loi_player_wide, possession_won_final_3rd_per_90)
top_25_save_percentage <- top_25_players(prem_loi_player_wide, save_percentage)
top_25_saves_per_90 <- top_25_players(prem_loi_player_wide, saves_per_90)
top_25_successful_tackles_per_90 <- top_25_players(prem_loi_player_wide, successful_tackles_per_90)
top_25_yellow_cards <- top_25_players(prem_loi_player_wide, yellow_cards)
top_25_red_cards <- top_25_players(prem_loi_player_wide, red_cards)
Function to plot the top 25 players based on a specific performance metric
This function plots the top 25 players based on a specific performance metric. The function takes the dataframe, specified metric (column name), and the title you want to use as inputs. The function uses ggplot2 to create a bar plot with labels for each player's metric value.
plot_metric <- function(data, metric, title) {
  data %>%
    ggplot(aes(x =reorder(participant_name,{{metric}}), y = {{metric}}, label = {{metric}})) +
    geom_bar(stat = "identity", fill = "green") +
    geom_label(aes(label={{metric}}), colour = "purple", fill = "white", size = 3, label.padding = unit(0.2, "lines"),
  label.r = unit(0.1, "lines"),
  label.size = 0.2,
  size.unit = "mm") +
    theme(
      legend.position = "none",
      axis.title.x=element_blank(),
      axis.title.y =element_blank(),
      #axis.text.x=element_blank(),
      #axis.ticks.x=element_blank(),
      plot.background = element_rect(fill = "purple", colour = "purple"),
      panel.background = element_rect(fill = "purple", colour = "purple"),
      panel.grid.major = element_line(colour = "purple"),
      panel.grid.minor = element_blank(),
      axis.line = element_line(colour = "white"),
      axis.text = element_text(colour = "white"),
      axis.title = element_text(colour = "white"),
      plot.title = element_text(colour = "white", hjust=.5, face="bold", size = 15),
      plot.subtitle = element_text(colour = "white", hjust=.5, face="italic", size = 8)) +
      coord_flip() +
    labs(x = "Player",
         y = title,
         title = title,
         subtitle = "League of Ireland Premier Division 2024

         Data: FOTMOB | @lorcanmason")
}
The function plot_metric creates a bar plot of the top 25 players based on a specific performance metric. The function takes three inputs: the dataframe containing player statistics, the column name of the performance metric you want to plot, and the title of the plot. The function uses ggplot2 to create a bar plot with labels for each player's metric value. The plot is customized with a purple colour theme and white text to enhance readability. The function returns a bar plot of the top 25 players ranked by the specified metric.
Using the function to plot the top 25 players for different metrics
Top 25 Players Attacking Metrics
plot_metric(top_25_goals, top_scorer, "Goals")
plot_metric(top_25_assists, assists, "Assists")
plot_metric(top_25_goals_assists, goals_assists, "Goals + Assists")
plot_metric(top_25_goals_per_90, goals_per_90, "Goals per 90")
plot_metric(top_25_big_chances_created, big_chances_created, "Big Chances Created")
plot_metric(top_25_big_chances_missed, big_chances_missed, "Big Chances Missed")
plot_metric(top_25_chances_created, chances_created, "Chances Created")
plot_metric(top_25_shots_per_90, shots_per_90, "Shots per 90")
plot_metric(top_25_shots_on_target_per_90, shots_on_target_per_90, "Shots on Target per 90")


Top 25 Players Possession Metrics
plot_metric(top_25_accurate_long_balls_per_90, accurate_long_balls_per_90, "Accurate Long Balls per 90")
plot_metric(top_25_accurate_passes_per_90, accurate_passes_per_90, "Accurate Passes per 90")
plot_metric(top_25_penalties_won, penalties_won, "Penalties Won")
plot_metric(top_25_successful_dribbles_per_90, successful_dribbles_per_90, "Successful Dribbles per 90")


Top 25 Players Defensive Metrics
plot_metric(top_25_blocks_per_90, blocks_per_90, "Blocks per 90")
plot_metric(top_25_clean_sheets, clean_sheets, "Clean Sheets")
plot_metric(top_25_clearances_per_90, clearances_per_90, "Clearances per 90")
plot_metric(top_25_fouls_committed_per_90, fouls_committed_per_90, "Fouls Committed per 90")
plot_metric(top_25_interceptions_per_90, interceptions_per_90, "Interceptions per 90")
plot_metric(top_25_penalties_conceded, penalties_conceded, "Penalties Conceded")
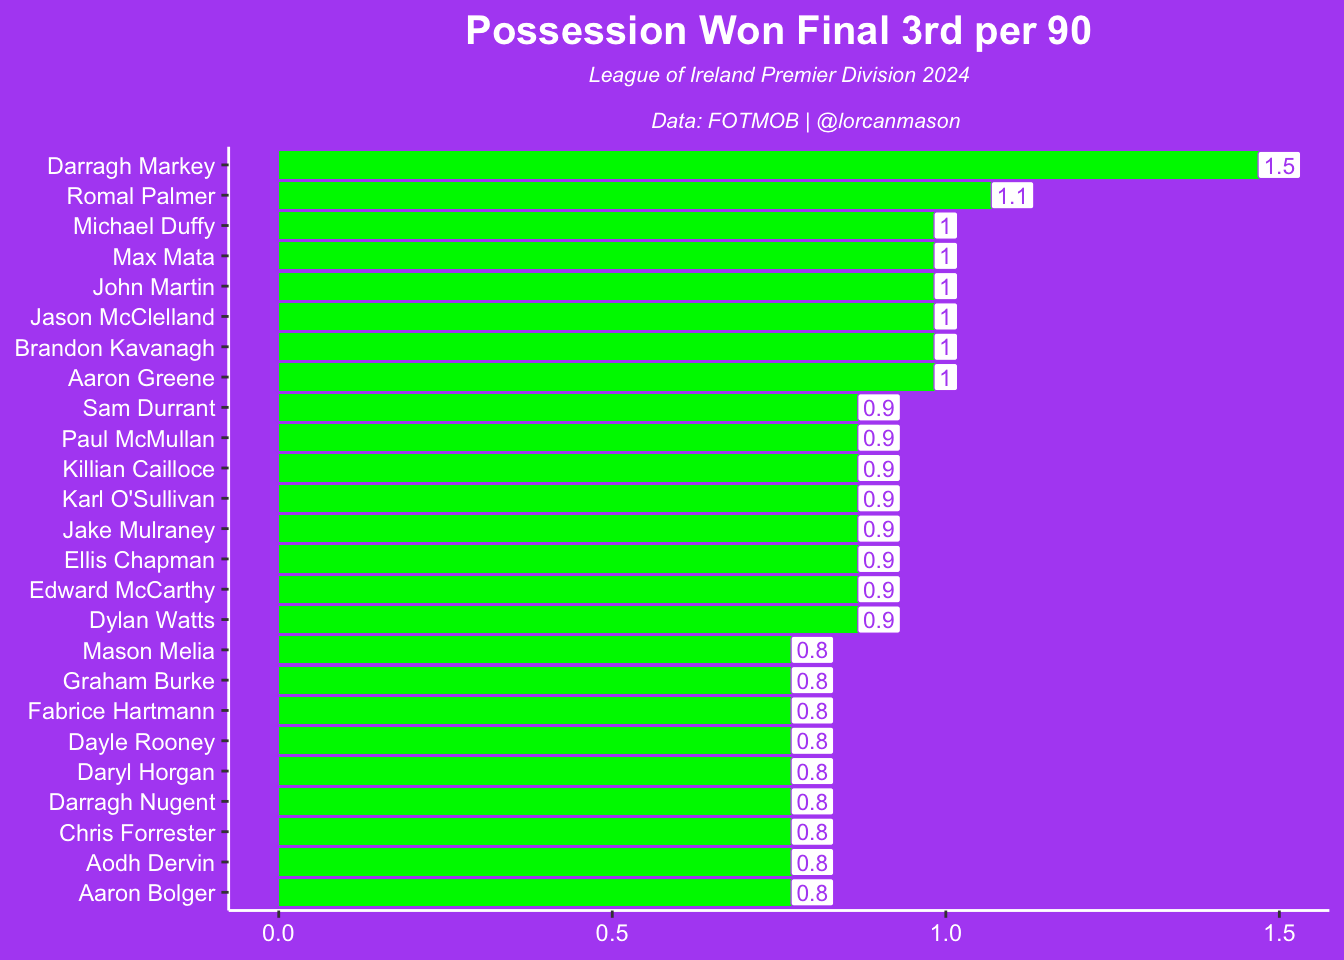
plot_metric(top_25_possession_won_final_3rd_per_90, possession_won_final_3rd_per_90, "Possession Won Final 3rd per 90")
plot_metric(top_25_save_percentage, save_percentage, "Save Percentage")
plot_metric(top_25_saves_per_90, saves_per_90, "Saves per 90")
plot_metric(top_25_successful_tackles_per_90, successful_tackles_per_90, "Successful Tackles per 90")
plot_metric(top_25_yellow_cards, yellow_cards, "Yellow Cards")
plot_metric(top_25_red_cards, red_cards, "Red Cards")


Conclusion
This report ranks the top 25 players based on various performance metrics in the League of Ireland Premier Division 2024. The analysis provides insights into the top-performing players in the league across different categories such as goals, assists, possession, and defensive metrics. The visualizations highlight the stand out players in each category, showcasing their contributions to their respective teams throughout the season. The data-driven approach offers a comprehensive overview of player performance and can be used to evaluate player effectiveness and impact on the league. For more detailed analysis and insights, further exploration of the data and additional metrics can be conducted.
Have fun, stay curious!